In this article I will describe how to set up some basic server monitoring and some very useful alarming using Datadog. This comes in many variants - but I'll show how to do this on a Ubuntu Linux server.
In this article I will explain why you should monitor and how you can set it up using Datadog. You will see how to set up a dashboard to keep a view on server metrics and even set up monitoring so you'll be alerted via mail if something goes off the rails.
Why monitor
When you have a service that is running and that your users depend on it is a very good idea to set up a system that lets you monitor and confirm that your service is actually runnning (this is a bit of a tangent - but you might of course be using your own service constantly - that way you'll find out instantly if something is not working correctly - but I'd seriously consider proper monitoring anyway).
So let's try and set that up shall we?!
What is Datadog - how to set it up
Datadog is a monitoring service that let's you build dashboards to monitor your cloud infrastructure. First we'll need an account - Datadog offers different plans depending on your needs.
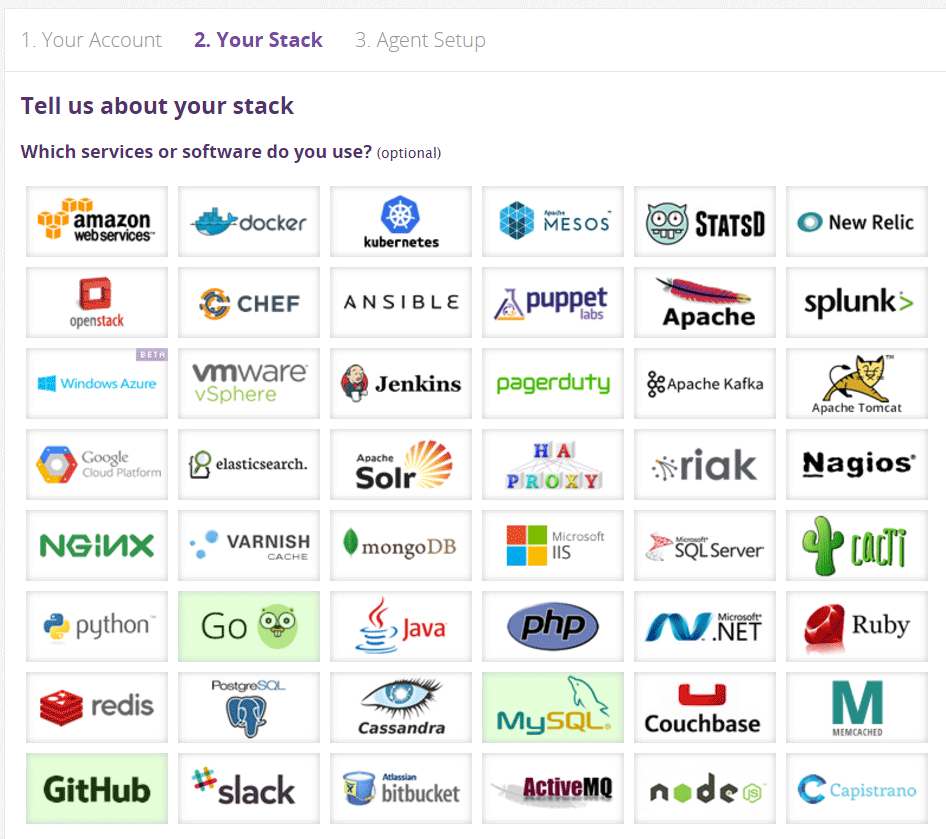
When signing up you need to tell Datadog a bit about you software stack. For the sake of this example I have checked "Go", "MySQL" and "GitHub" as I want to monitor a service written in Go that uses a MySQL server and is deployed from source hosted on GitHub.
You'll also need to tell Datadog a bit about your organization size and monitoring goals.
Next you'll continue to agent installation - this is the part where you actually install the monitoring agent on your server - it's pretty easy and you really just have to pick your operating system and follow the steps in the guide. I am installing on an Ubunutu server which gives me a single command to run.
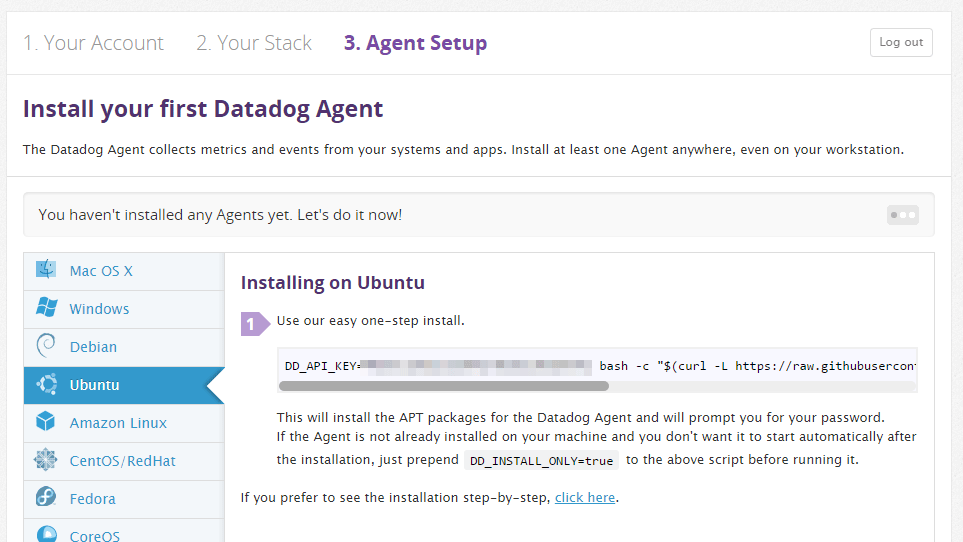
When the agent is successfully installed on the server it will start reporting to Datadog and the "Finish" button will be come active on the website.
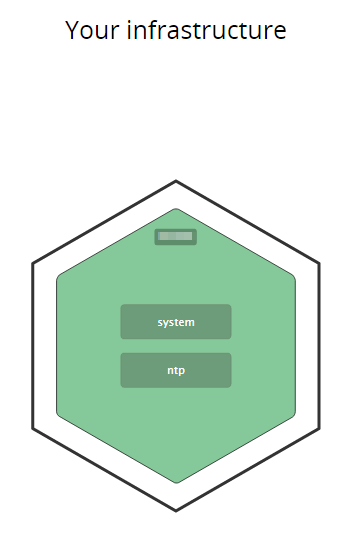
You can then continue to the infrastructure overview and see that your server is present there. All green means that everything is running - no problems!
Setting up a dashboard
Now let's make a dashboard to properly monitor our server. In this brief setup we won't get into the application specifics - but instead we'll focus on monitoring the server and it's resources.
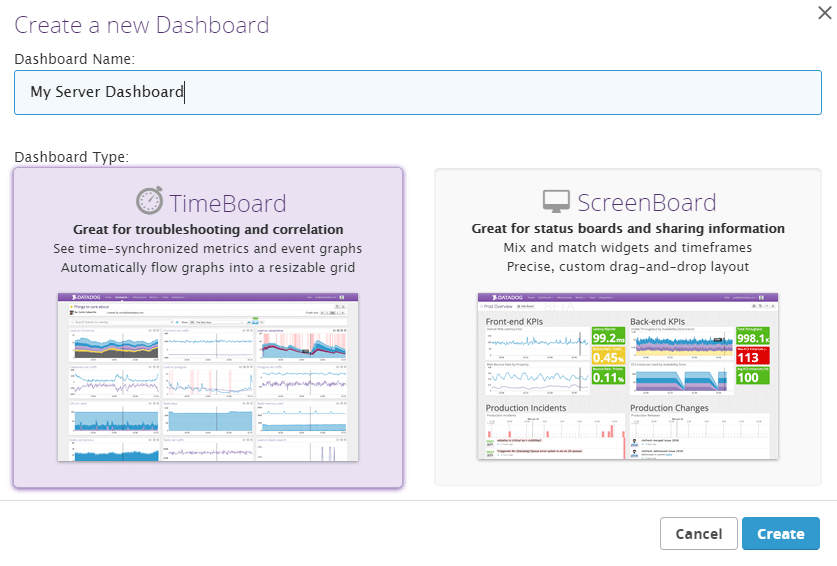
We will creating a new dashboard for this - using the "TimeBoard" dashboard type:
CPU
We like to see the CPU we buy/rent utilized - but if the CPU is running too much it might be a sign that our server is in bad shape. Either the application(s) it is running are badly written or something else is wrong. Maybe we have CPU spikes and maybe they scale with the overall usage - but running high constantly should generally be seen as a sign that something needs to change.
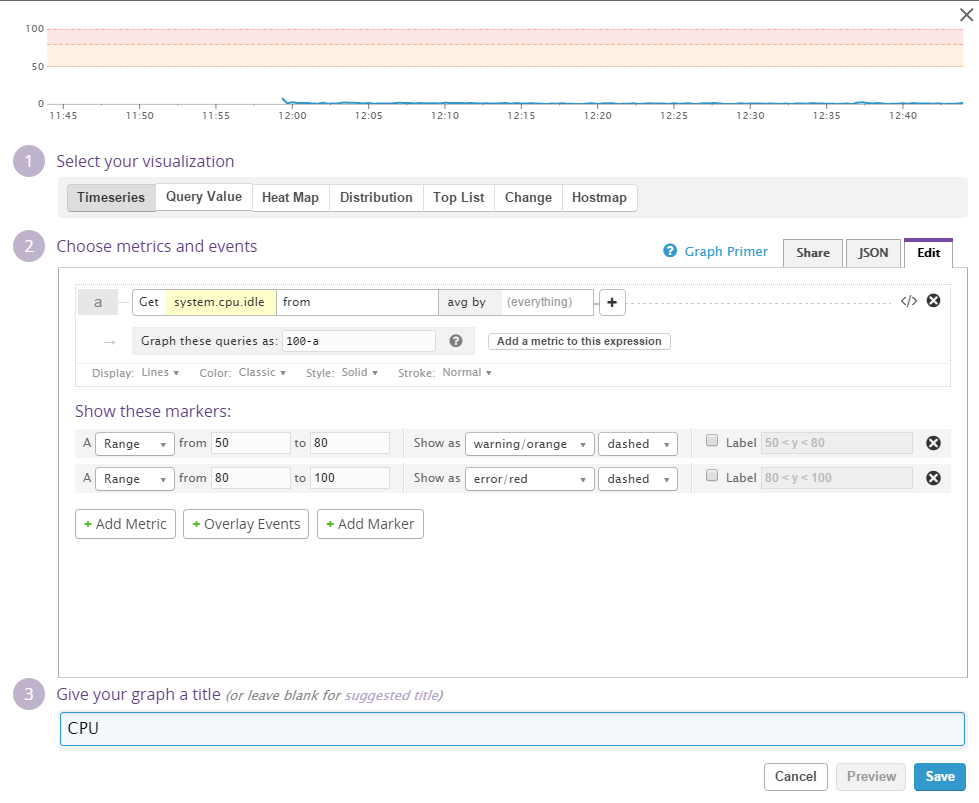
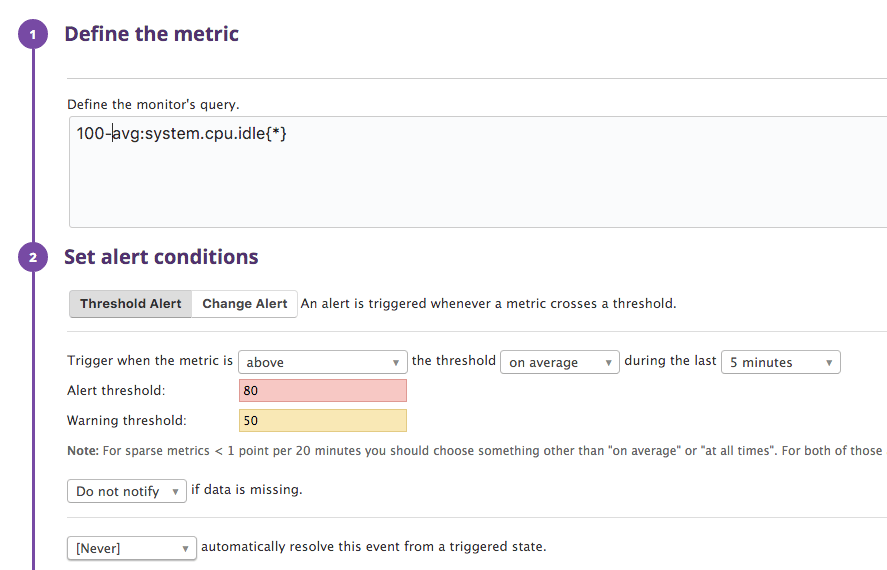
For the CPU monitoring we add a new "Timeseries" widget. CPU time can be broken down into various metrics - but we are mostly not interresting in doing that. Instead we want to know about the overall usage - a metric that isn't present - so we'll make it ourselves. Datadog has a system.cpu.idle metric and if we just subtract that value from 100 we have the percentage the CPU is utilized. This can be done by clicking the "Advanced" button on the right of the configuration.
Let's add some markers to the widget. Let's say we have a yellow marker for values over 50 (percent) and a red marker for values over 80. Now we are ready to save the widget.
Memory
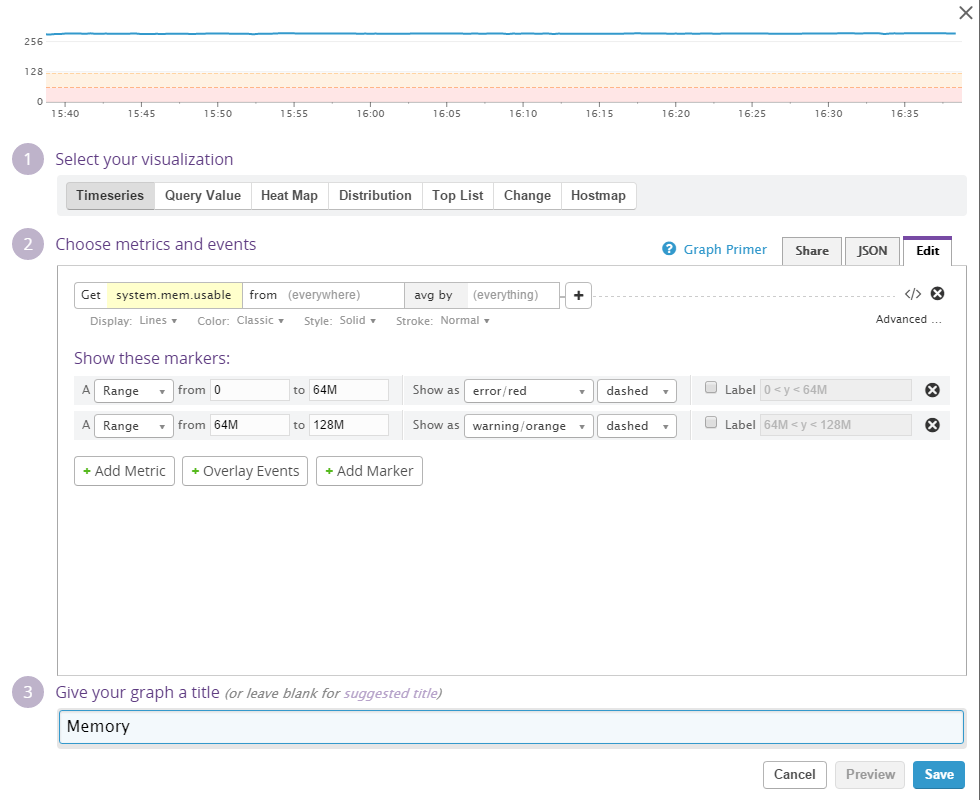
Usually the operating system has different ways of reporting memory - for my Ubuntu box there is several metrics regarding memory. The correct one to monitor here is the one called system.mem.usable - it is the total amount of memory free for allocation at any given time. A part of this portion of memory might be used by the OS for caching eg. - but it can be made available to running processes.
The server I am configuring has a total of 512 MB RAM and I will set my levels accordingly. I will set a red area from 0 to 64 MB and a yellow from 64 MB to 128 MB to indicate the thresholds I want to monitor. Memory usage isn't as critical as CPU - a high memory utilization is somewhat prefered - but when the total amount of memory is used the machine will start using swap space - and that can slow the processing down by an order of magnitude.
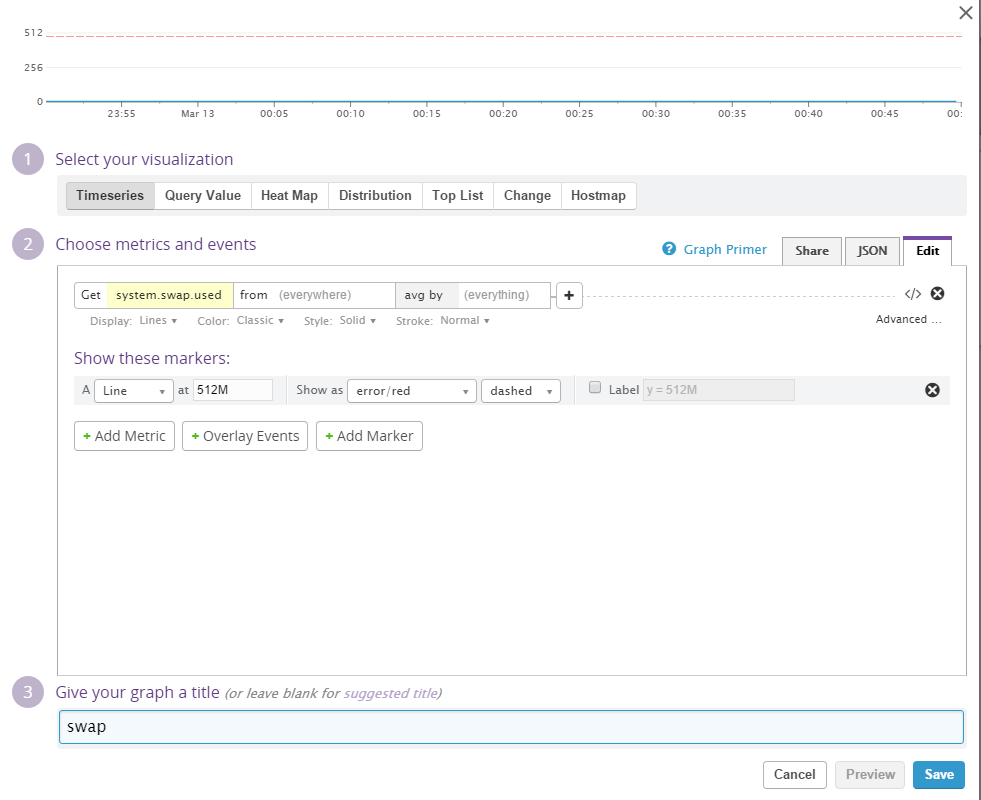
As mentioned the machine will start using swap space when all available RAM is used. Se we'd better monitor swap as well.
A quick widget to monitor how much swap is currently in use. The machine has 4 GB swap space - but I'll set a red line at 512 MB - it should be a reasonable assumption that if the machine is usin twice the amount of memory it has available in RAM we should probably do something about it.
Disk space
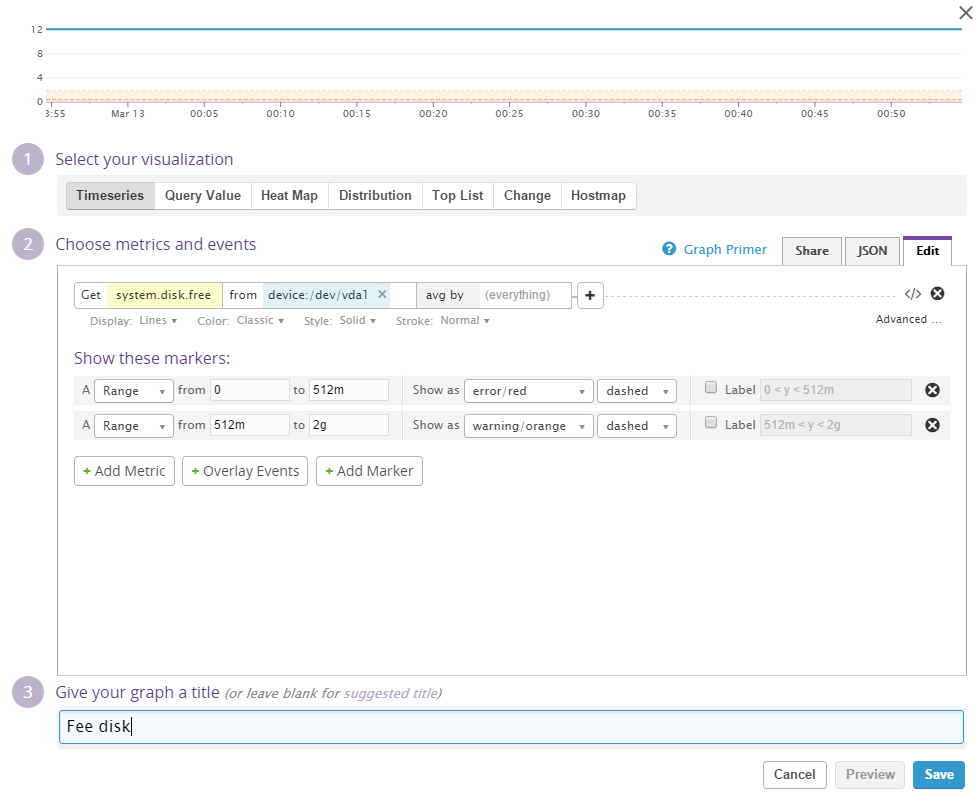
The machine in question doesn't do any tasks that will cause a sudden spike in disk usage. I'll ad a widget to monitor the system.disk.free metric. Markers for low disk space is set for yellow at 2 GB and red at 512 MB.
When monitoring disk space it is important to verify the from parameter. It is default set to blank - which will cause Datadog to monitor average disk space on all partitions/devices. The standard Ubuntu (and mony other OS) have some small special purpose disks which will ruin monitoring if included. On this system the from parameter is set to device: /dev/vda1.
Network traffic
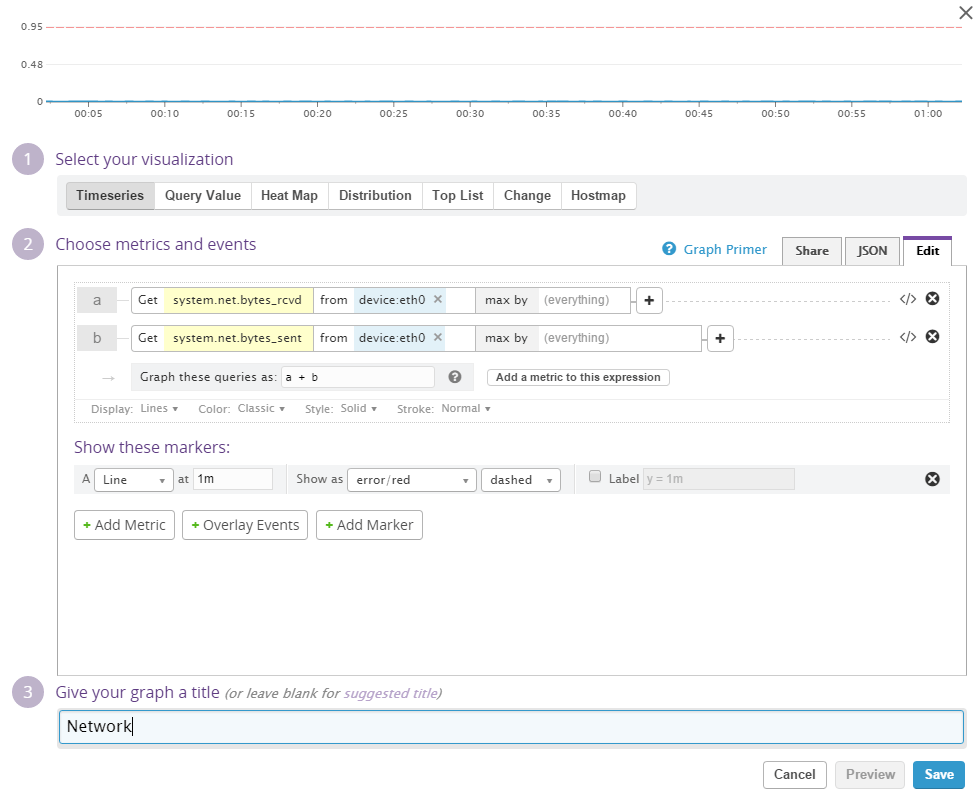
The network widget will monitor the throughput in the network device. I will set the widget up to monitor both upstream and downstream data (by adding them). Please note that the network device has to be selected and the option to use the max value (instead of the average) should also be selected.
Setting limits for network speed is hard. For now I'll add a red marker line at 1 MiB/s - that is - if network utilization is above this I would like to know about it. This limit should depend on many factors and the network throughput is actually a metric that doesn't matter that much when inspected alone. High network utilization along with a burning CPU is another story - but it is still nice to have the network transfer on our dashboard.
Setting up monitoring
In the previous section we created a dashboard to give us an overview of our server - that way we can log in and inspect the metrics and see how the server is running.
The next step is to set up some monitors to alarm us via mail when the metrics we are go into the yellow and/or red zones we defined when we made the dashboard.
General status
First we set up a monitor that can give us an alarm if the the system stops. An easy way to achieve this is to trigger when data doesn't come from the system to Datadog. This is done by creating a new Host monitor that looks at all hosts and alarms if there is no data in two minutes.
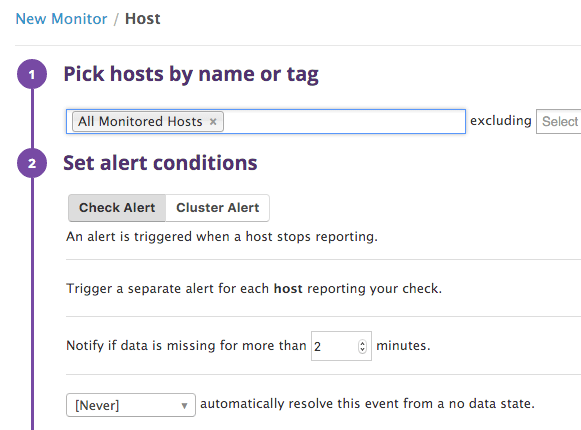
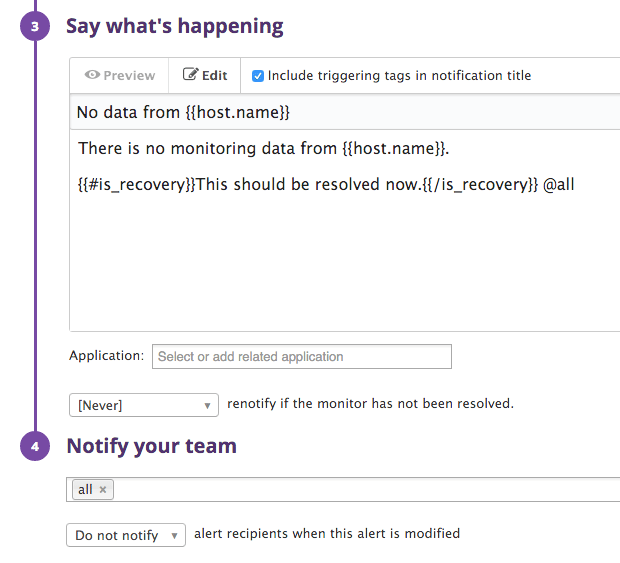
And then enter a nice description (this is the template for what is sent in the mail when the alarm triggers) and select who gets the alarm:
CPU
The monitoring of the CPU usage should mirror the setup we made on the dashboard. Warning value is over 50% and alarm is above 80% - we set the threshold to 5 minutes - that way small spikes (system updates etc.) won't be reported - feel free to change this to fit your needs:
You must also enter a template and select users that gets this alarm.
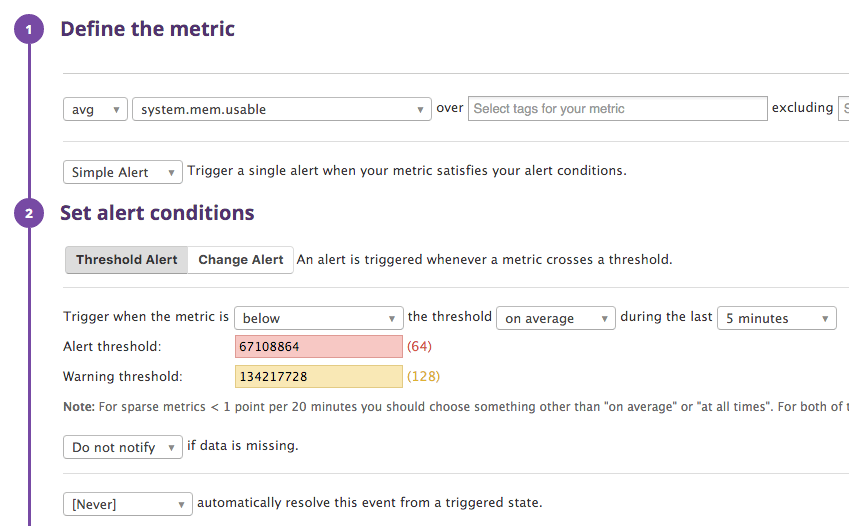
Memory
We make an alarm for the memory (RAM) the same way as we made the CPU alarm - it should also mirror our dashboard setup:
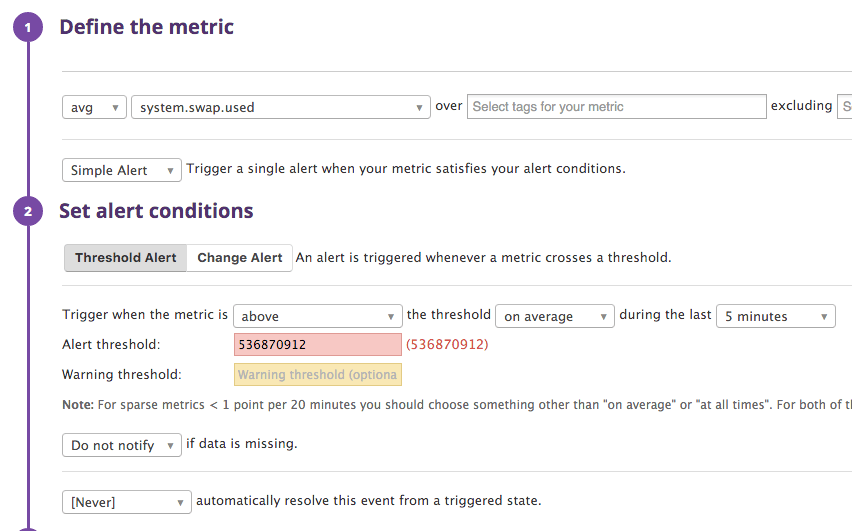
And we do the same for swap:
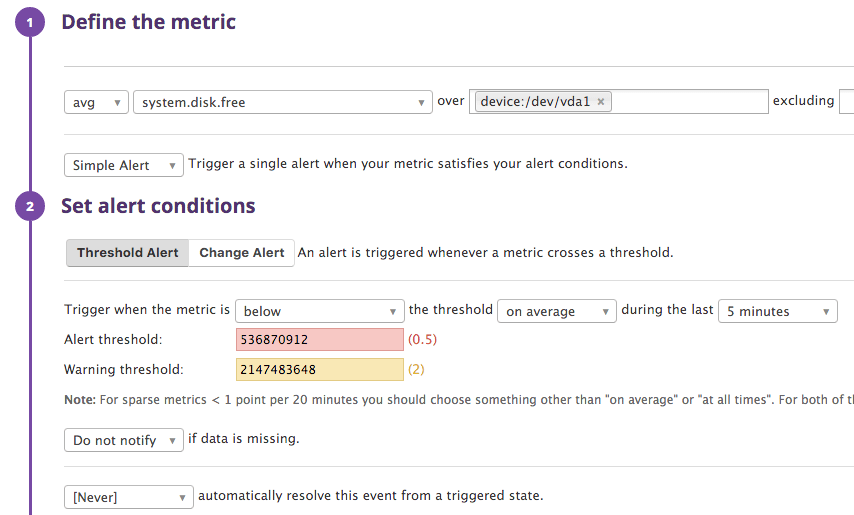
Disk space
Disk space is set up the same way, but remember we have to select the disk we want to monitor specifically:
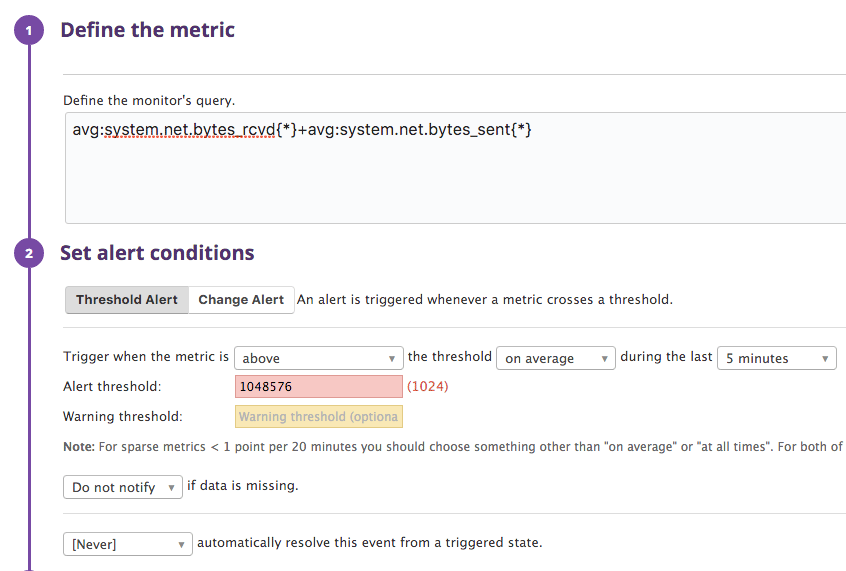
Network traffic
Network traffic needs a bit of tweaking to get the metric right - just like when the dashboard was set up:
Conclusion
Using this setup you can have Datadog monitor your system and send you alarms when something is not running as smoothly as desired.
When you have a server running your own applications there will be a lot more to monitor that these (simple) system metrics - but that is a task we'll save for later.